This feature is a useful way of looking at the WEMS system's activity history, in order to understand trends and to look for ways to improve efficiency.
To view the system logs:
- Go to | .
A new browser window will open with options to view several different types of logs.

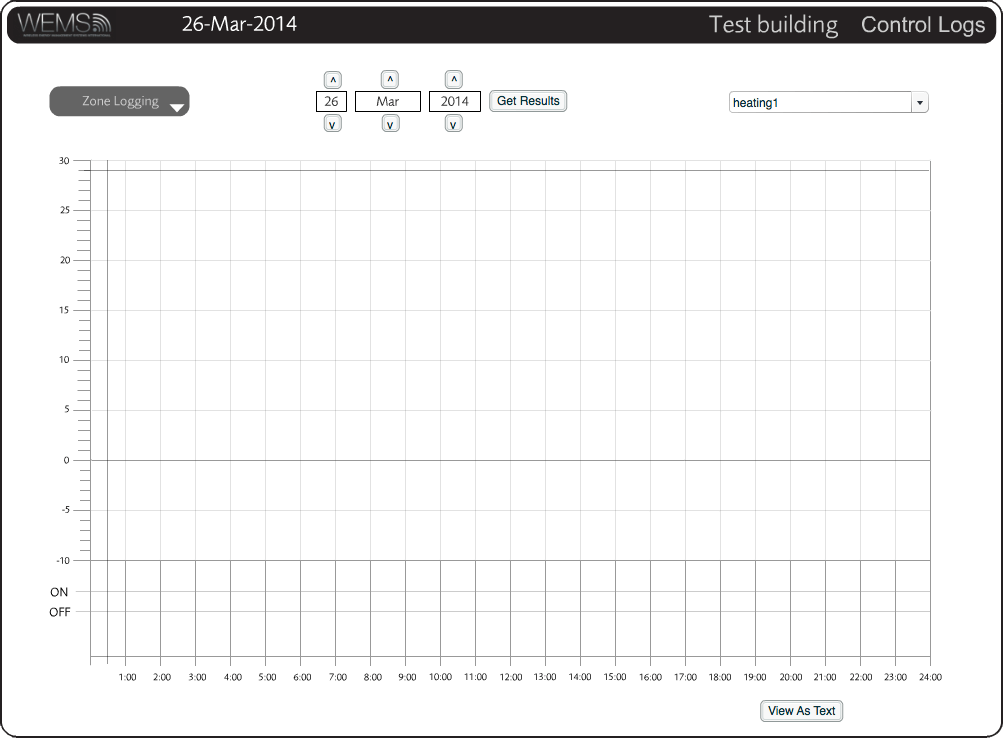
The Logging window in its default 'graph' mode
- Use the dropdown menu in the top-left corner to select
the
 type
of log you would like to view.
- Use the arrow buttons to choose the date of the logs you would like to view (the default will be today's date).
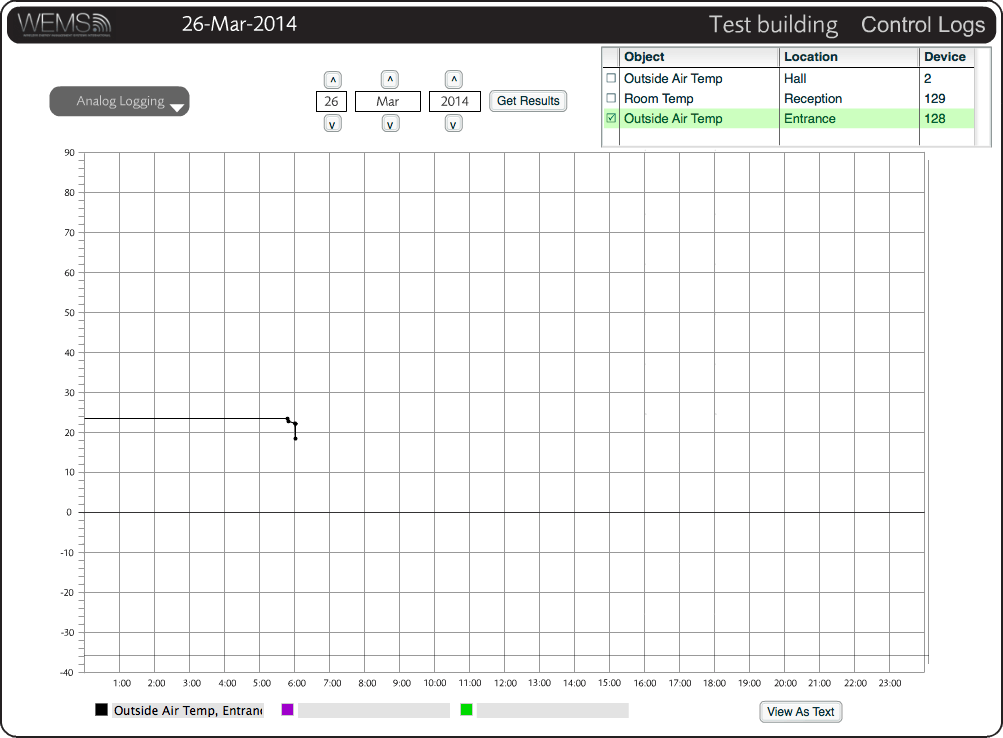
- Depending on the type of log being viewed, you will either need to select a Zone option from a dropdown menu or tick boxes to choose from a list of Objects (see images to the right).
- Click Get Results.
A graph of the logs will now be displayed. Temperature logs are now shown to values as low as −39.9°C.

The Logging window showing Object selection tick boxes
Viewing Logs As Text
By default, the log will be displayed in the main part of the screen in the form of a graph. If you wish to view the data as text, click in the bottom-right corner. Click to revert to the previous view.

The Logging window in its alternative 'text' mode
Viewing the logs in 'text' mode can be useful should you ever need to keep a separate summary of activity. In 'text' mode the logged data is easy to copy and paste into a document or email.